
Last Month in the Markets: December 1st – 29th, 2023
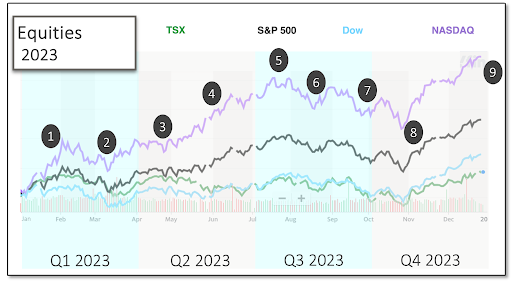
Last Year in the Markets: January 3rd -December 29th, 2023

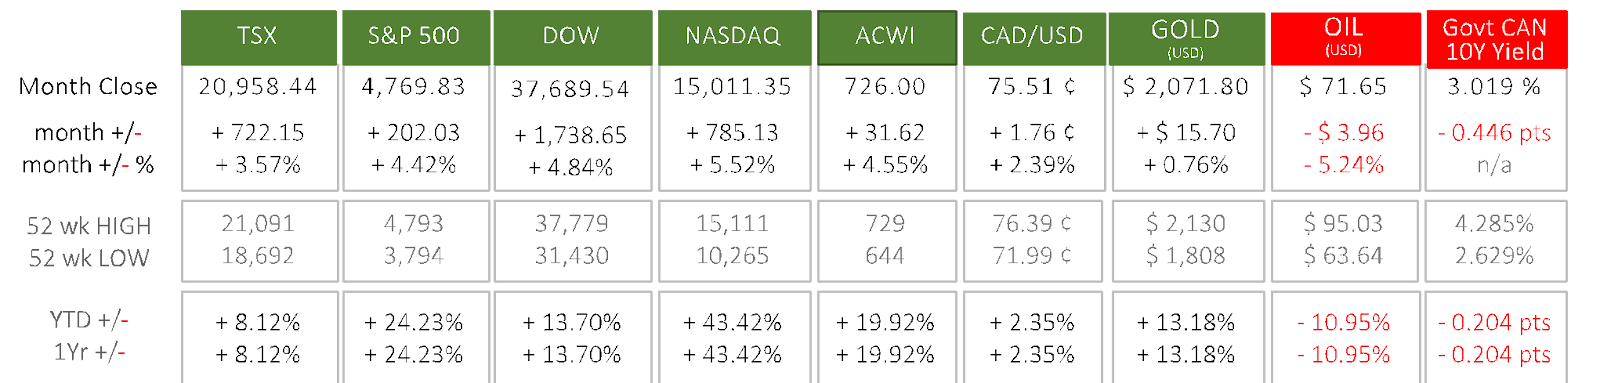
What happened in 2023?
As the uniform colouring of the tables above show, the last few months, marked by a very strong December, decided the trend for financial markets in 2023.
The U.S. equity indexes delivered the strongest annual returns, especially the NASDAQ, which soared by 43% as Generative AI developed as the prevailing theme. A large part of the upside in equities was concentrated in a small group of the highest market capitalization companies in the sectors of IT, Communication Services, and Consumer Discretionary. With a more limited exposure to this concentration, the S&P 500 rose 24% and the Dow gained 13.5%.
The end of year gains came from an optimistic frenzy about the prospects of interest rates peaking and a soft landing. Fueled in part by positive interpretations of remarks made by Federal Reserve Chair Jerome Powell. The heavy rally included both equities and bonds. After the 10-year treasury bond interest rate climbed 1.11% between January and October, it gave all of that back in November and December, collapsing to the same level seen at the end of 2022. FOMC Press Conference
The laggard for the major North American equity indexes was Canada’s TSX, which still delivered a respectable 8% for the year. The Canadian dollar added nearly 2.5% (1.73 cents) compared to its American counterpart, adding to the overall positive domestic result.
International equities mostly ended the year with positive gains as well, except for the Chinese market, which sold off due to a sluggish domestic economic recovery. This was a disappointment for investors, who had hopes set on a ramp up in growth after the post covid re-opening.
Oil dropped 11% last year, including more than 5% in December alone. The fall in the price of gasoline, which is directly linked to the price of crude oil, has contributed to falling inflation around the globe.
Geopolitical events and tensions between the U.S. and China, Russia’s continued invasion of Ukraine, and the war in Gaza, along with the strong drop in yields, helped positive momentum for gold. Which also accelerated in the last few months of the year. Slightly more than half of it’s rise in 2023 occurred after October 7th.
Here were the major events of the year:
- January’s month-long rise with a mid-month stumble
- January 7th – The year began with the U.S. House of Representatives unable to elect a Republican Speaker of the House. Eventually, after 15 votes Kevin McCarthy prevailed, and then speculation began that he had ceded too much power to achieve his position. Debate regarding the Republican’s ability to move the economy forward by cutting taxes also commenced as McCarthy’s tenuous leadership started. CNN and McCarthy
- January 19th – Equities faltered as the U.S. debt ceiling reached its limit. The Department of the Treasury began utilizing extraordinary measures to keep the federal government operating for about five months.
- January 30th – The two last days of the month were negatively affected by the upcoming Federal Reserve interest rate announcement on February 1st. Markets wavered between accepting economic “good news” at face-value or interpreting “good news” as fuel to propel additional interest rate increases by the Fed. CNBC and rate
- Mid-March gully delays gains
- March 10th and 12th – We saw a financial institution fall out from the sharp rise in interest rates. As short-term rates rose, banks had to pay higher interest rates on deposits, while the long-term investments they used to fund these payments continued at lower rates, causing a narrowing of margins. A confidence-crisis and bank-run resulted, which caused regulators in California to shut down Silicon Valley Bank on March 10th. This led to widespread worry about bank solvency, which was amplified when the FDIC closed Signature Bank on March 12th. This crisis triggered a decline in equity indexes. SVB Fallout Spreads
- Equity markets began a tentative recovery after the U.S. Treasury Department, Federal Reserve and Federal Deposit Insurance Corporation added increased protections for depositors and introduced a new borrowing facility to allow banks to meet short-term liquidity needs. Joint release
- March 19th – The Swiss bank Credit Suisse was exposed and was rescued by UBS under very generous conditions. Switzerland’s Attorney General launched a criminal investigation into the takeover, which caused damaged to the bank’s reputation. Swiss investigation CS/UBS
- March 10th and 12th – We saw a financial institution fall out from the sharp rise in interest rates. As short-term rates rose, banks had to pay higher interest rates on deposits, while the long-term investments they used to fund these payments continued at lower rates, causing a narrowing of margins. A confidence-crisis and bank-run resulted, which caused regulators in California to shut down Silicon Valley Bank on March 10th. This led to widespread worry about bank solvency, which was amplified when the FDIC closed Signature Bank on March 12th. This crisis triggered a decline in equity indexes. SVB Fallout Spreads
- Late April dip then a protracted climb into summer
- April 12th – The U.S. Bureau of Labor Statistics released consumer inflation data for March. Prices had risen 0.1% and the year-over-year rate was measured at 5.0%. The annualized rate remained stubbornly above the Federal Reserve’s target of 2%. Markets worried that heightened inflation would lead to additional monetary policy tightening. BLS release
- About two hours later, the Bank of Canada (BoC) released its interest rate announcement. For the second consecutive time, the Bank did not change its policy interest rate, holding the target for the overnight rate at 4.5%. Bloomberg and Fed rate increases BoC release
- April 25th all indexes dropped close to 1% in the first hour of trading, but by the end of the month those short-term losses had been reversed as strong economic news emerged. Gross Domestic Product (GDP) and Personal Consumption Expenditures (PCE) price index data were the main drivers. GDP grew at a rate of 2.6% in the final quarter of 2022, and the 2.1% for all of 2022. PCE, which is the Federal Reserve’s preferred inflation indicator, rose 4.2% in March, down from February’s 5.1%. This resulted in a strong uptick for equities. It appeared that the economy was slowing, and inflation was softening, which reduced pressure on the Federal Reserve to continue raising interest rates. CNBC GDP & PCE BEA PCE release
- May 3rd – U.S. Federal Reserve increased its federal funds rate by 25 basis points. Predictions that the Fed would not raise rates were proved wrong, but the meeting minutes of the Federal Open Market Committee indicated that the decision was not unanimous. Equities dipped temporarily on recession fears. Fed press conference
- May 5th – Equites recovered quickly from the Fed’s rate increase when Canadian and U.S. jobs data was released. Employment rose by 41,000 and 253,000 in April respectively, and unemployment remained unchanged in both countries at 5.0% and 3.4%. The strength of the jobs market showed that a recession was not immediately on the horizon. StatsCan Labour Force Survey BLS employment
- April 12th – The U.S. Bureau of Labor Statistics released consumer inflation data for March. Prices had risen 0.1% and the year-over-year rate was measured at 5.0%. The annualized rate remained stubbornly above the Federal Reserve’s target of 2%. Markets worried that heightened inflation would lead to additional monetary policy tightening. BLS release
- Climb continued through June and into July
- June 2nd – The U.S. jobs market continued its strong growth when nonfarm payroll increased by 339,000 in May, which is more than March and April’s employment increases of 217,000 and 294,000, respectively.
- June 9th – Canadian “overall employment was little changed in May, as employment fell by 77,000 for youth aged 15 to 24 and it increased by 63,000 among people aged 25 to 64” according to May’s Labour Force Survey.
- June 13th – The Bureau of Labor Statistics released U.S. inflation data for May showing consumer price increases of 0.1% in May and year-over-year of 4.0%. Prices had risen 0.4% in April, and May’s annualized inflation rate was the lowest since March 2021.
- June 14th – The Federal Reserve delivered a interest rate decision to holding rates steady and markets reacted mostly favourably. The pause in interest rate increases was expected to be temporary, since the 2% inflation target had not been reached. Simultaneous to the interest rate announcement was the release of the Fed’s Summary of Economic Projections, which contains the dot-plot, which collects the individual opinions of Federal Open Market Committee (FOMC) members for upcoming interest rates. FOMC members had projected that interest rates will rise into 2024 before falling slightly, and lower rates in the 3 to 3.5% range will arrive in 2025.
- June 30th – The Bureau of Economic Analysis reported that the Federal Reserve’s primary inflation indicator, the Personal Consumption and Expenditures price index rose by 0.1% in May after rising 0.4% in April.
- Mid-July Peak
- July 7th – Continued strength in employment for June held markets steady. The increase of 60,000 and 209,000 additional jobs in Canada and the U.S., respectively, represented a situation where “good news” might be “bad news”. Worries that a robust labour market could fuel consumer demand and inflation and might require more severe monetary policy from the Bank of Canada and the Federal Reserve kept markets were wary. They did not rise on this news, which might of otherwise be interpreted positively. StatsCan Employment data BLS Jobs
- July 12th – The U.S. Bureau of Labor Statistics reported that the CPI had risen 0.2% in June, and the all-items index had risen 3.0% over the last 12 months. BLS inflation
- The Bank of Canada increased its benchmark interest rate by .25 percent (25 basis points) to 5%. “However, robust demand and tight labour markets are causing persistent inflationary pressures in services” according to the Bank’s press release and in its Monetary Policy Report. The lowering inflation and tempered policy by the Bank of Canada were viewed positively and markets turned upward.
- June 18th – StatsCan announced annualized inflation at 2.8%, which was down from the previous month’s annual inflation of 3.4%. StatsCan CPI data
- July 26th – The Federal Reserve increased its interest rates, again by 25 basis points. Some had hoped for a pause in rate increases as inflation slowed, but once the news was digested, markets rose again. Fed Press Conf
- July 28th – The Fed’s primary inflation indicator, the Personal Consumption Expenditures price index, showed an increase of 3.0% over the past year and 0.2% for June. PCE Release
- August dips on ratings downgrade and China’s woes
- August 1st – Fitch Ratings downgraded the quality of U.S. sovereign debt from “AAA” to “AA+” reflecting “the expected fiscal deterioration over the next three years, a high and growing general government (GG) debt burden, and the erosion of governance relative to peers that has manifested in repeated debt limit standoffs and last-minute resolutions.” The government debt issue is driven by weaker federal government revenue, new spending initiatives, and higher interest rates. The general government deficit was predicted to rise to 6.9% of Gross Domestic Product in 2025. CBC and Fitch Press Release from Fitch
- August 4th – U.S. Employment situation summary and the Canadian Labour Force Survey were both released. Markets treated this data with wariness as the American job market continued its resiliency. Concern that interest rates would remain at current levels grew. In the U.S., non-farm payroll employment rose by 187,000 jobs in July. Employment in Canada was static in July with 6,000 less jobs, a change of less than one-tenth of a percent. StatsCan July Jobs BLS Jobs NYTimes Jobs
- August 14th – Economic indicators from China, the world’s second largest economy with significant international trade, began to turn downward. China’s economic recovery and growth showed to slow. Economic integration with Canada and the U.S. differed in magnitude and trade balance so “bad news from China” affected different North American stocks and sectors differently. Canada’s closer ties caused a steeper decline, but both countries were impacted negatively. China Trading Partners China’s economic woes
- Early October Climb
- September 30th and October 1st – Just as the month began, a stop-gap measure extending spending for an additional 45 days avoided a U.S. government shutdown. CNBC and “shutdown” CNN and “shutdown”
- October 6th – “Total nonfarm payroll employment rose by 336,000 in September, and the unemployment rate was unchanged at 3.8 percent”, according to the U.S. Bureau of Labor Statistics. BLS Jobs
- October 11th and 12th – U.S. producer and consumer inflation data was released. The Producer Price Index (PPI) increased 0.5% in September, down slightly from 0.7% in August. Year-over-year prices advanced 2.2%, which is the largest increase since April. Consumer prices rose 0.4% in September, down from 0.6% in August. Over the last 12 months the Consumer Price Index (CPI) had risen 3.7%, which was the same reading as in August BLS PPI release BLS CPI release
- October 17th – Canada’s CPI was lower than expected. On a year-over-year basis, consumer prices rose 3.8% in September, slightly lower than the 4.0% gain measured in August. CBC and CPI StatsCan CPI release
- October 25th – The Bank of Canada kept the policy interest rate unchanged. According to the press release, “Inflation has been easing in most economies, as supply bottlenecks resolve, and weaker demand relieves price pressures. However, with underlying inflation persisting, central banks continue to be vigilant.” This dropped hints on which direction the next Federal Reserve announcement would go. BoC Press Release CBC and BoC
- October 26th – U.S. GDP grew faster than expected during the third quarter. The annualized pace is 4.9%. CNBC and GDP BEA release
- October 27th – In September, the PCE price index rose 0.4%. Core PCE (excluding volatile food and energy) increased 3.7% on a year-over-year basis. BEA and PCE CNBC and PCE
- Early November dip before more gains
- November 1st – The U.S. Federal Reserve held the federal funds rate changed. No promises of rate reductions were offered. Fed release CNBC equities and Fed
- November 3rd – The Canadian economy added 18,000 jobs in the previous month, after adding 64,000 jobs in September and 40,000 in August. October’s performance represents a slowing of the Canadian economy. The unemployment rate rose to 5.7%, the fourth consecutive monthly increase. StatsCan release
- The Bureau of Labor Statistics reported that nonfarm payroll had risen by 150,000 in October, and the unemployment rate rose 0.1% to 3.9%. BLS release
- November 9th – Federal Reserve Chair, Jerome Powell, stated at an International Monetary Fund meeting that interest rates may not be high enough, yet, to bring inflation back to the 2% target, demonstrating the sensitivity of markets to interest rate speculation. AP and Powell
- November 14th – The U.S. annualized Consumer Price Index reported an increase of 3.2% for October, down from September’s increase of 3.7%. The Federal Reserve’s pause on interest rate increases appeared to be well reasoned at this time. U.S. equity indexes rose 1.5% to 2.5% and the TSX jumped 1.6% for the day. BLS CPI CNBC and CPI More CNBC and CPI
- November 15th – After the U.S. House of Representatives passed another spending bill the day before, the Senate voted 87-11 to end the third and latest fiscal standoff ahead of its deadline. CNN and US Govt
- November 21st – The Canadian Consumer Price Index (CPI), rose 3.1% on a year-over-year basis for October, down from 3.8% in September. Gasoline prices fell by 7.8% in October and was the primary driver of lower overall inflation. StatsCan CPI release
- November 30th – Canadian GDP dropped 0.3% in the third quarter after rising by the same amount in the second quarter. Less exports, slower inventory accumulation, and greater household savings contributed to the decline. StatsCan GDP release
- The US Bureau of Economic Analysis released that the Personal Consumption and Expenditures (PCE) price index had risen 0.1% in October, and 3% from a year ago. CNBC and PCE BEA PCE release NYTimes and PCE
- End of Year Positivity
- December 13th – Fed Chair Jerome Powell gave remarks hinting at a peaking of interest rates at the FOMC press conference. FOMC press conference
- December 19th – Canada’s Consumer Price Index (CPI) rose 3.1% on a year-over-year basis in November, which matched October’s increase. Excluding food and fuel the CPI rose 3.5%, up slightly from 3.4% for the same measure in October. StatsCan inflation release
- The European Union reported that their Harmonised Index of Consumer Prices (HICP) was 3.1%. A year earlier, the annual inflation rate was 10.1%. EU HICP release
- December 22nd – The PCE price index fell 0.1% in November and rose 2.6% on a year-over-year basis according to the Bureau of Economic Analysis. BEA PCE release
What’s ahead for 2024?
The next round of interest rate and monetary policy announcements will not begin until January 24th and 31st for the Bank of Canada and Federal Reserve, respectively. The Governing Council of the European Central Bank meets next on January 25th, and the Bank of England has scheduled its next release of Monetary Policy Committee actions on February 1st.
While through 2023 Canada and Europe have followed the expected trajectory of economic slowing, resilience in the US came as surprise. This could be in part from the continued heavy spending fiscal policy of the US government, which is acting more like it should after recessionary pressures have already taken hold and inflation is at target, rather than when inflation is still too high.
The recent US market enthusiasm priced in a few factors playing out to an ideal conclusion. The prospect of a return to accommodative monetary policy sooner than initially forecasted, with economic resilience holding to avoid a recession, a small increase in unemployment leading to better supply and demand dynamics that tempers inflation, without that leading to a significant rise in unemployment, as well as Generative AI providing a boost to earnings through an increase in productivity. These factors will likely decide whether the soft-landing scenario plays out. It is what we have been seeing so far, which leads to the market pricing it in.
However, we are now in the most restrictive policy since the 1980s and other several recession signals have been triggered. A soft landing is far from certain. This including a decrease in household excess savings and spending, which could accelerate as the effects of higher rates continue to be felt. There is also the slowing payroll growth and rise in unemployment. While the current rise in unemployment is exactly what the market wants to see, historically, increases in unemployment tend to spiral. Lastly, the yield curve is still inverted, which is a signal that has proceeded the last nine recessions. We believe that the US market has gotten a head of itself by pricing in the best-case scenario. Consumer Spending US unemployment rate Forbes
Continued slower economic growth for Canada is most likely in the cards for 2024. As this happens, we should see rates start to come down with the Bank of Canada departing from their current holding strategy, paving a way for new growth opportunities as we re-start to the business cycle. In comparison, Canada’s economy is more cyclical than the US, which makes Canadian equities more vulnerable to recessions, but while US valuations are not priced for a recession, Canadian valuations are more reasonable.
Europe will likely be in a similar scenario, as it is also showing reasonable valuations and slowing economic growth. Whether this means the subsequent recovery of these two regions will come before the US, or that the US will remain on a different trajectory all together, we will see. Regardless, we see the potential for better opportunity later in 2024 and continue to have a defensive tilt to our asset allocation, with a focus on income and quality holdings.
Qopia Investments is a trade name of Aligned Capital Partners Inc. (ACPI). ACPI is regulated by the Investment Industry Regulatory Organization of Canada (www.iiroc.ca) and a Member of the Canadian Investor Protection Fund (www.cipf.ca). Qopia Investments is registered to advise in securities and mutual Funds to clients residing in Alberta, Ontario, Saskatchewan, and British Colombia. This publication is for informational purposes only and shall not be construed to constitute any form of investment advice. The views expressed are those of the author and may not necessarily be those of ACPI. Opinions expressed are as of the date of this publication and are subject to change without notice and information has been compiled from sources believed to be reliable. This publication has been prepared for general circulation and without regard to the individual financial circumstances and objectives of persons who receive it. You should not act or rely on the information without seeking the advice of the appropriate professional.
Investment products are provided by ACPI and include, but are not limited to, mutual funds, stocks, and bonds. Non-securities related business includes, without limitation, fee-based financial planning services; estate and tax planning; tax return preparation services; advising in or selling any type of insurance product; any type of mortgage service. Accordingly, ACPI is not providing and does not supervise any of the above noted activities and you should not rely on ACPI for any review of any non-securities services provided by
Investment products are provided by ACPI and include, but are not limited to, mutual funds, stocks, and bonds. Non-securities related business includes, without limitation, fee-based financial planning services; estate and tax planning; tax return preparation services; advising in or selling any type of insurance product; any type of mortgage service. Accordingly, ACPI is not providing and does not supervise any of the above noted activities and you should not rely on ACPI for any review of any non-securities services provided by Qopia Financial.
Any investment products and services referred to herein are only available to investors in certain jurisdictions where they may be legally offered and to certain investors who are qualified according to the laws of the applicable jurisdiction. The information contained does not constitute an offer or solicitation to buy or sell any product or service. Past performance is not indicative of future performance, future returns are not guaranteed, and a loss of principal may occur. Content may not be reproduced or copied by any means without the prior consent of the author and ACPI.
Disclosure of commissions in mutual funds in accordance with NI 81-102 (15):“Commissions, trailing commissions, management fees and expenses all may be associated with mutual fund investments. Please read the prospectus before investing. Mutual funds are not guaranteed, their values change frequently, and past performance may not be repeated”.